Alarm fatigue
Alarms that flap around a threshold and hundreds of notifications during maintenance hide what matters.
Alarm engine
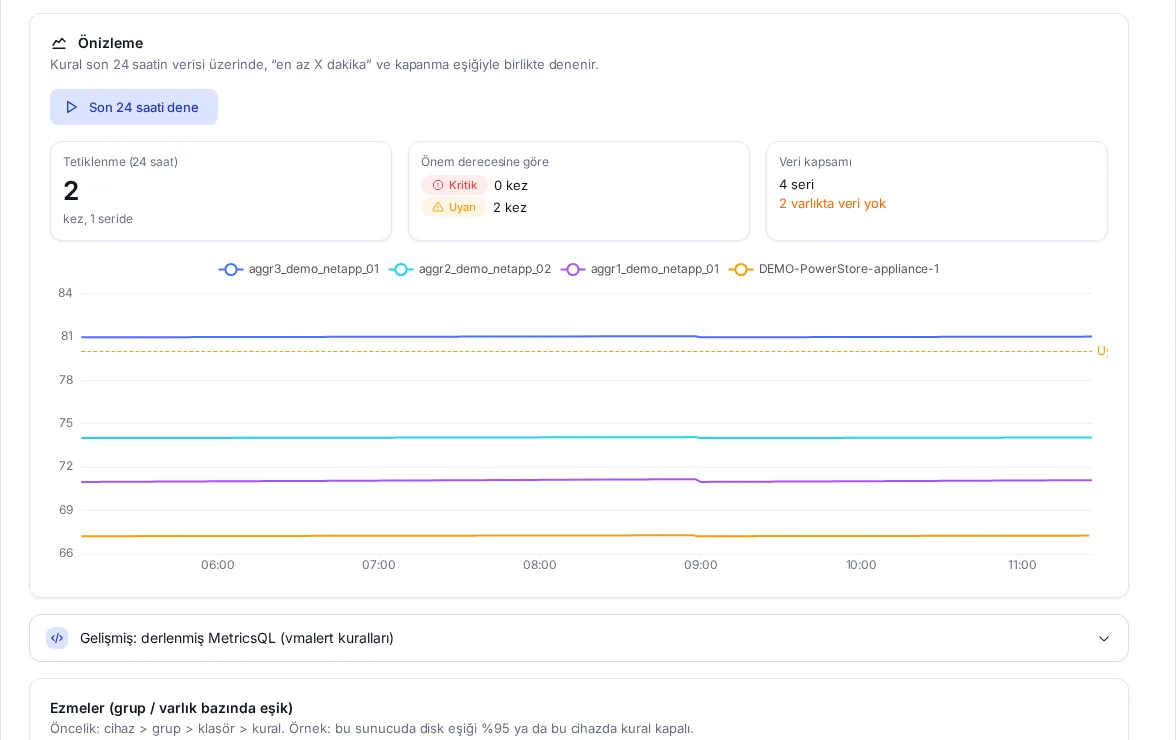
The Netronus alarm engine evaluates the metrics of every module in the same rule editor. Durations and a separate recovery threshold cut needless alarms; forecast and baseline rules warn you before a problem grows. Before saving a rule you see how many times it would have fired in the last 24 hours.
The problem
Alarms that flap around a threshold and hundreds of notifications during maintenance hide what matters.
An alarm when the disk is already full is too late; the trend should be visible earlier.
Separate tools for network, servers and storage mean separate rules and separate notification settings.
The solution
Rules are written against the metric dictionary and do not care about the data source: disk usage from SSH or from the agent triggers the same rule. Ready-made templates ship with the modules; thresholds can be overridden per folder, group or single asset.
Capabilities
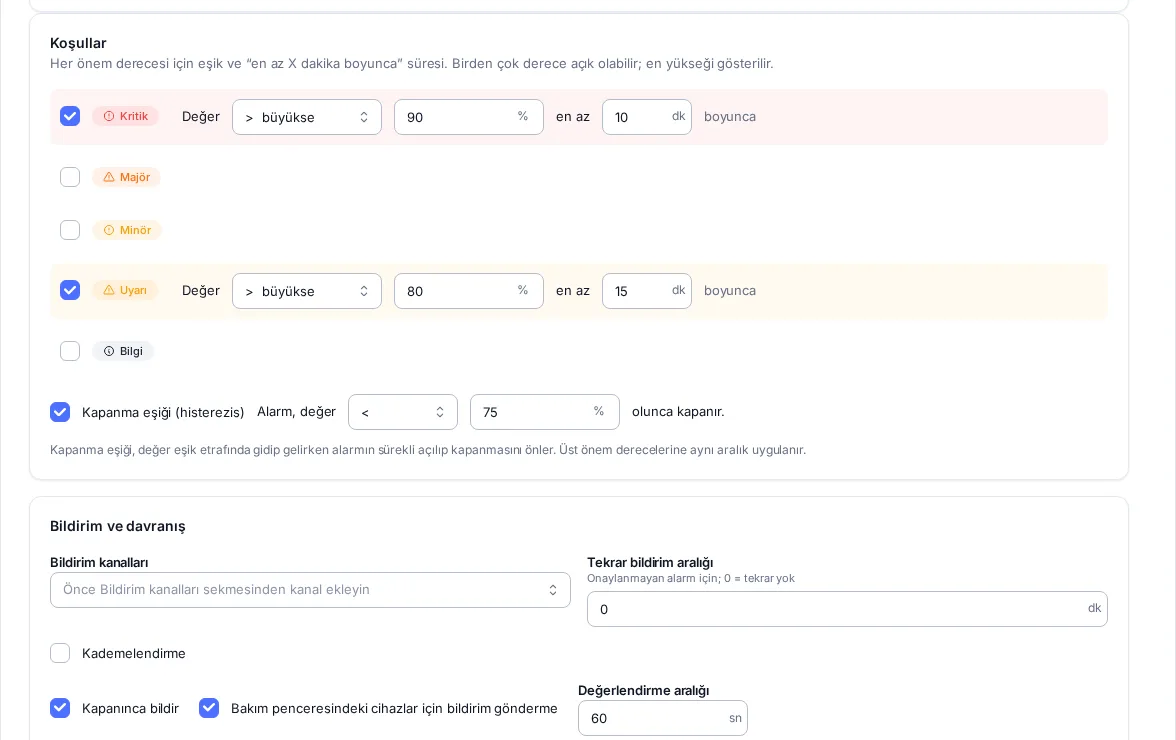
Warning to critical levels, a “for at least X minutes” condition and a separate recovery threshold.
For example “usage grew by more than 10% in one hour”.
Trend rules such as “this disk or pool will be full in 7 days”.
Catches unusual deviation compared with the same hour in previous weeks.
Alarms when an asset stops sending data.
Alarms on assets in maintenance are visible but not notified; if still open when maintenance ends, they are notified.
While a host is down no separate alarms are raised for its VMs; suppression lifts when the parent recovers.
An alarm that opens and closes often within a short time is flagged and its notifications stop.
Per-channel minimum severity, notify on recovery, repeat notifications and escalation; signed webhooks for ITSM, digest messages during alarm storms.
Try a rule on the last 24 hours before saving: how many times, at which severity, on how many series it would have fired.
Technical summary
| Item | Detail |
|---|---|
| Rule types | Threshold, state, rate of change, forecast, dynamic baseline, no data |
| Severities | Information, Warning, Minor, Major, Critical |
| Scope | Asset type, folder, group, single asset, label filters and exclusions |
| Overrides | Asset > group > folder > rule precedence |
| Notification channels | E-mail, SMS, webhook (signed) |
| Suppression | Maintenance window, dependency, flapping, repeat |
| Scale test | 500,000 series, evaluated every minute |
| Large rules | Split automatically by series count |
We will set up a demo on your network, show the screens with your own devices and prepare a quote for the modules you need.
Request a demoRelated
Network, servers, virtualization, storage, flow, logs, configuration and security in one interface. Only the modules you need; from one server to a cluster.
Explore the moduleMonitor Linux and Windows servers agentless over SSH, WinRM, SNMP and Redfish, or in depth with the lightweight Netronus Agent.
Explore the moduleNetApp, Dell, Pure Storage, HPE, Huawei and IBM arrays plus Brocade and Cisco MDS SAN switches; see how many days are left before a pool fills up.
Explore the moduleWe will set up a demo on your network, show the screens with your own devices and prepare a quote for the modules you need.