Spot outages before users do
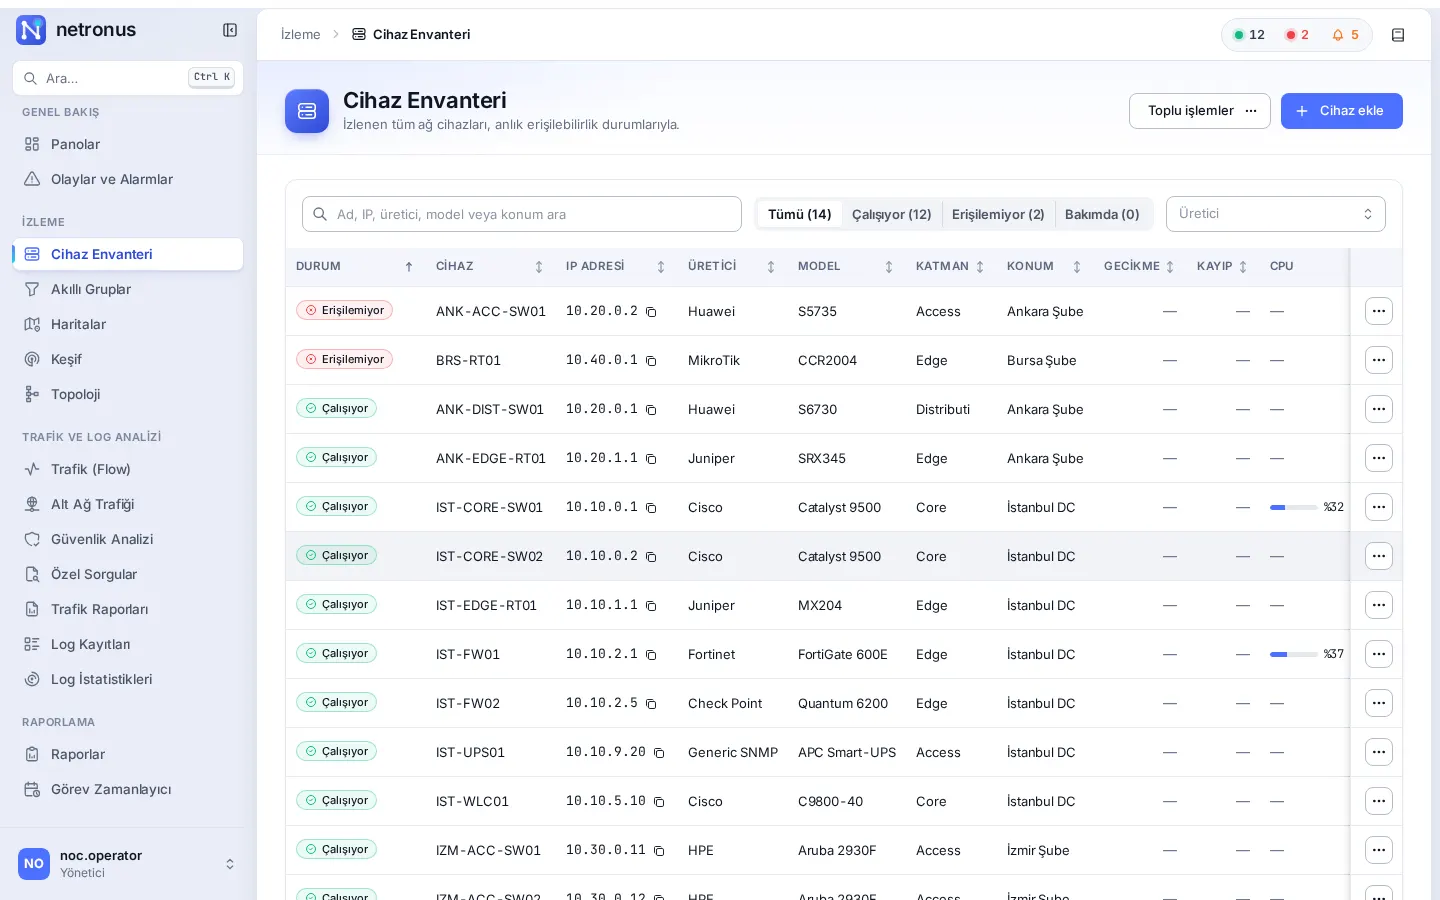
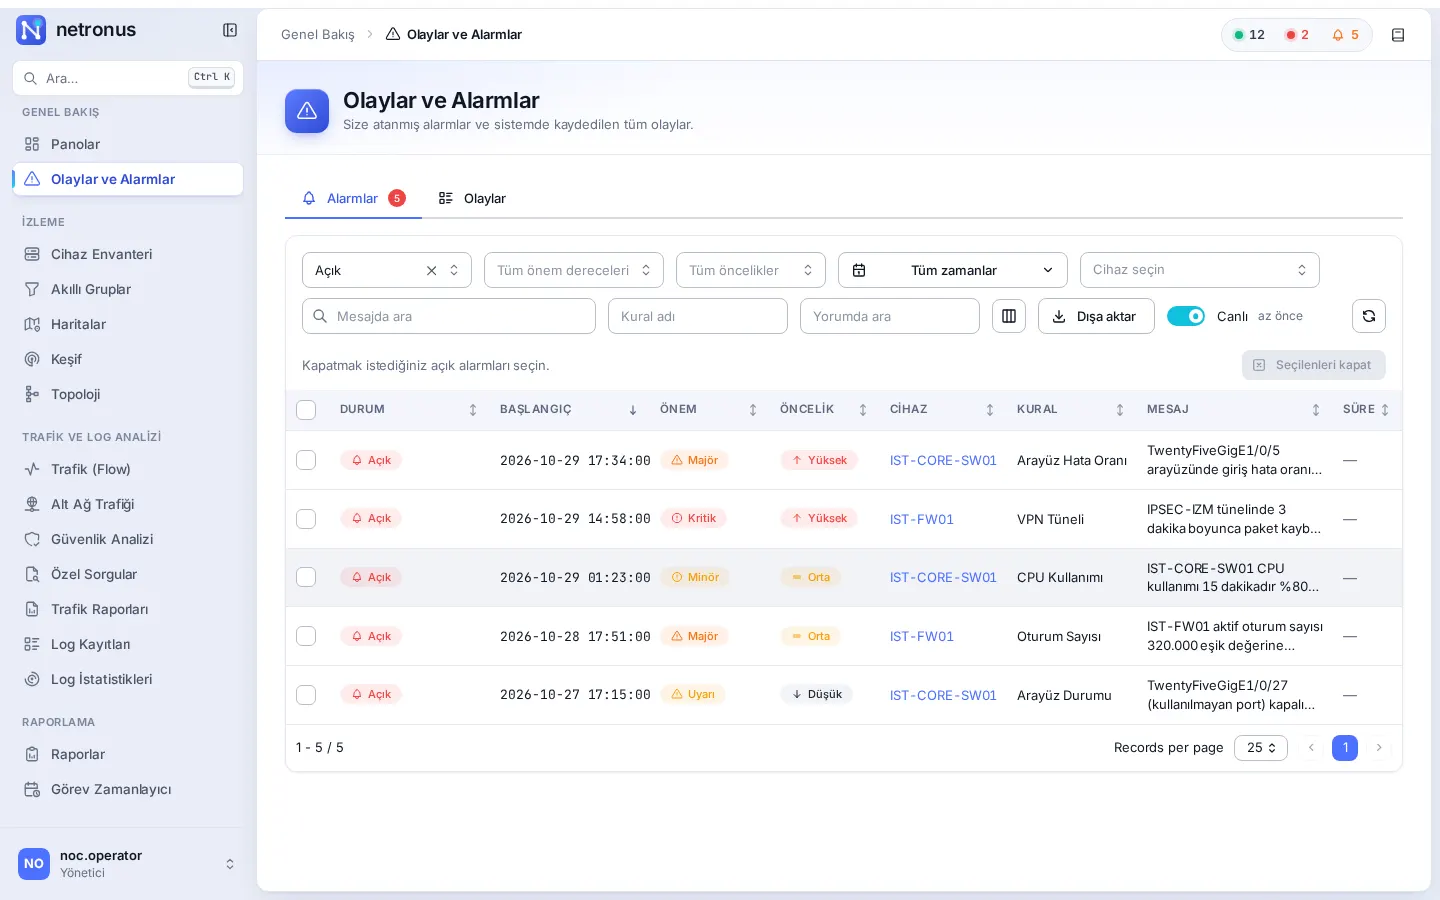
Unreachable devices, CPU spikes and interface errors show up on the dashboard and in the alarm list before the first ticket arrives.
Devices, interfaces, sensors, alarms
Netronus continuously measures the reachability, interface traffic, errors and hardware health of every device in your inventory. Flexible alarm rules and triggers notify your team by email, SMS, HTTP POST or SNMP trap when a threshold is crossed, and can even remediate automatically on the device.
Problems it solves
Unreachable devices, CPU spikes and interface errors show up on the dashboard and in the alarm list before the first ticket arrives.
Rules with thresholds, durations and reset conditions; linked rules are correlated into a single event.
Cisco, Juniper, Huawei, Fortinet and more in the same inventory, measured the same way.
Capabilities
Ping for reachability, latency and packet loss; SNMP v1, v2c and v3 (noAuthNoPriv, authNoPriv, authPriv; MD5/SHA, DES/AES) for deep metrics.
Bandwidth, drop, discard, broadcast and multicast counters; interface up/down history and real-time SNMP traffic.
CPU, memory, temperature, fan and power-supply status; component performance such as FPC and Routing Engine on Juniper devices.
IP SLA measurements and state changes on Cisco devices, plus application-level traffic with NBAR.
Poll any MIB value periodically with OID sets; each set is tested against a live device before it is saved.
Dynamic groups by vendor, location, tier and more; custom inventory views whose folders are populated by rules.
Conditions, target devices or interfaces, and ordered actions. Rule chains collapse related events into one alarm.
Email (SMTP), SMS API, HTTP POST, SNMP trap and syslog message; call records assigned to specific users.
Send an SNMP SET or run a configuration template on the device when an alarm fires; add wait steps between actions.
Put devices into maintenance during planned work: no false alarms, and every maintenance window is logged.
Live dashboards built from value, gauge, line, bar, pie, table and tree widgets, with shareable guest dashboard links.
Per-tier polling interval and success threshold, reflected directly in availability reports.
Detailed feature list
Related modules
Scan your network and add devices to the inventory, build the topology from LLDP/CDP, and watch your sites on a geographic map.
Explore the moduleProduce availability, interface, hardware, IP SLA and system reports from ready-made templates, calculate them over business hours, and run them on a schedule.
Explore the moduleCentrally collect, filter and live-tail syslog and SNMP trap messages, and keep them tamper-evident with time-stamped signatures.
Explore the moduleLet’s schedule a demo in your own environment or prepare a quote for your needs. Pricing depends on the number of devices and the modules you choose.